Correlation (or Dependence)
WORK IN PROGRESS
Correlation is a statistical measure that describes the interdependence of two or more variables. It is a measure of how close two variables are to having a linear relationship with each other. The closer the correlation value is to -1 or 1, the stronger the relationship between the variables. The closer the correlation value is to 0, the weaker the relationship between the variables.
Warning
Correlation not imply causation.
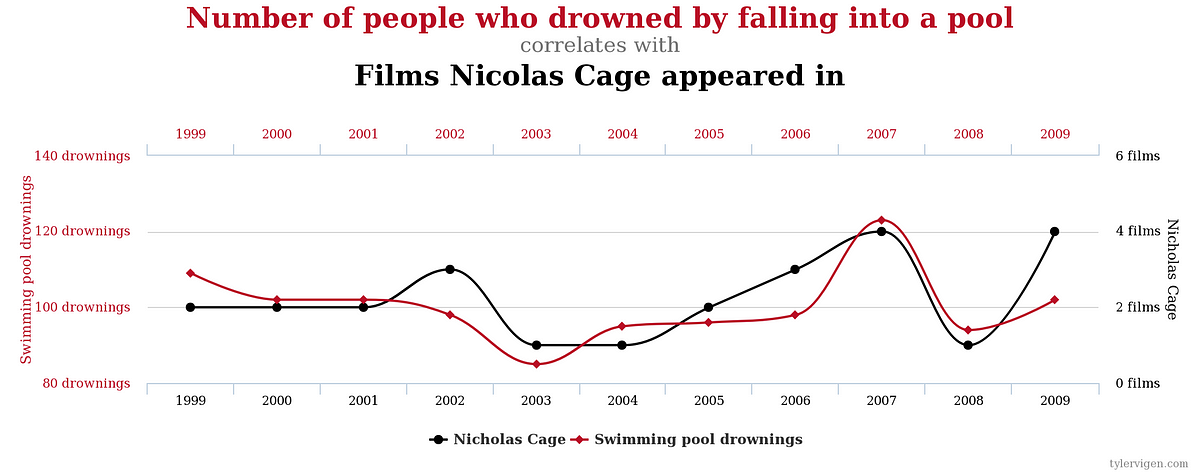
Take a look in this graph:

The graph shows a strong correlation but it's obvious that it is a coincidence. The correlation is not a proof of causation.
Covariance
Before look at how to calculate the correlation, we need to understand about covariance.
Covariance is a measure of the joint variability of two random variables. It is a measure of how changes in one variable are associated with changes in a second variable. It is similar to variance, but where variance tells you how a single variable varies, covariance tells you how two variables vary together.
Pearson Correlation Coefficient
The Pearson correlation is commonly used in linear correlations. It is a measure of the linear correlation between two variables X and Y. It has a value between +1 and −1, where 1 is total positive linear correlation, 0 is no linear correlation, and −1 is total negative linear correlation.
Spearman Correlation Coefficient
The Spearman correlation is commonly used in non-linear correlations. It is a measure of the monotonicity of the relationship between two variables X and Y. It has a value between +1 and −1, where 1 is total positive monotonicity, 0 is no monotonicity, and −1 is total negative monotonicity.
Kendall Correlation Coefficient
The Kendall correlation is commonly used in non-linear correlations. It is a measure of the ordinal association between two measured quantities. It has a value between +1 and −1, where 1 is total positive association, 0 is no association, and −1 is total negative association.
This is the most robust correlation coefficient. But is also the most computationally expensive.
P-value
P-value is the probability of obtaining test results at least as extreme as the results actually observed during the test, assuming that the null hypothesis is correct. The smaller the p-value, the stronger the evidence against the null hypothesis.
- p < 0.001: strong evidence that the null hypothesis is false
- p < 0.05: moderate evidence that the null hypothesis is false
- p < 0.1: weak evidence that the null hypothesis is false
- p > 0.1: no evidence that the null hypothesis is false
References
Joint probability distribution Correlation Correlation does not imply causation